Qiskit StateViz
STATUS · MIT license · on PyPI · Qiskit Ecosystem submission planned, not yet listed
The problem
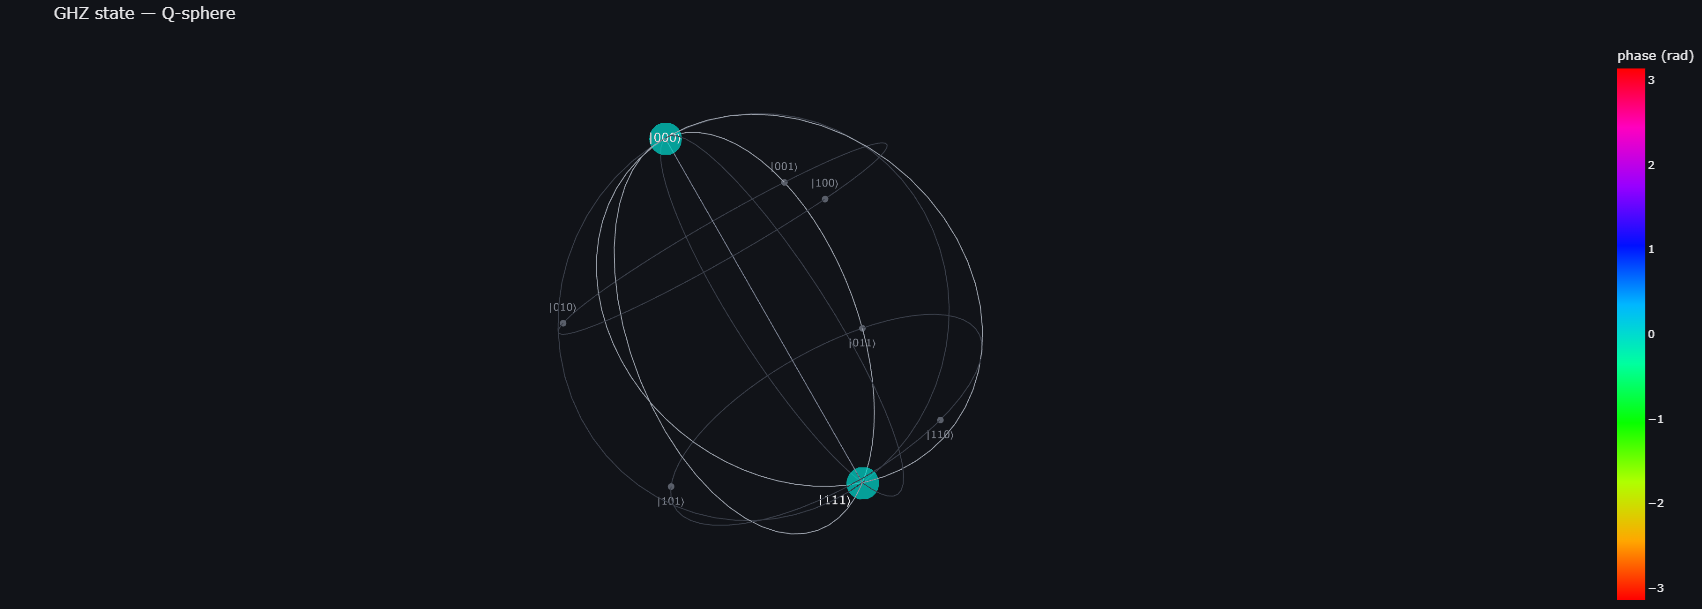
Qiskit’s built-in plot_state_qsphere and plot_bloch_multivector return static matplotlib figures. Fine for a paper, but hard to actually explore — you can’t rotate a Q-sphere to see its phase structure or check exactly where a Bloch vector points from a flat PNG.
What it does
qiskit-stateviz gives you interactive equivalents that take the same Statevector / DensityMatrix objects you already have:
from qiskit import QuantumCircuit
from qiskit.quantum_info import Statevector
from qiskit_stateviz import plot_qsphere_interactive, plot_bloch_multivector_interactive

qc = QuantumCircuit(3)
qc.h(0)
qc.cx(0, 1)
qc.cx(1, 2)  # GHZ state

sv = Statevector(qc)

fig = plot_qsphere_interactive(sv, title="GHZ state")
fig.show()

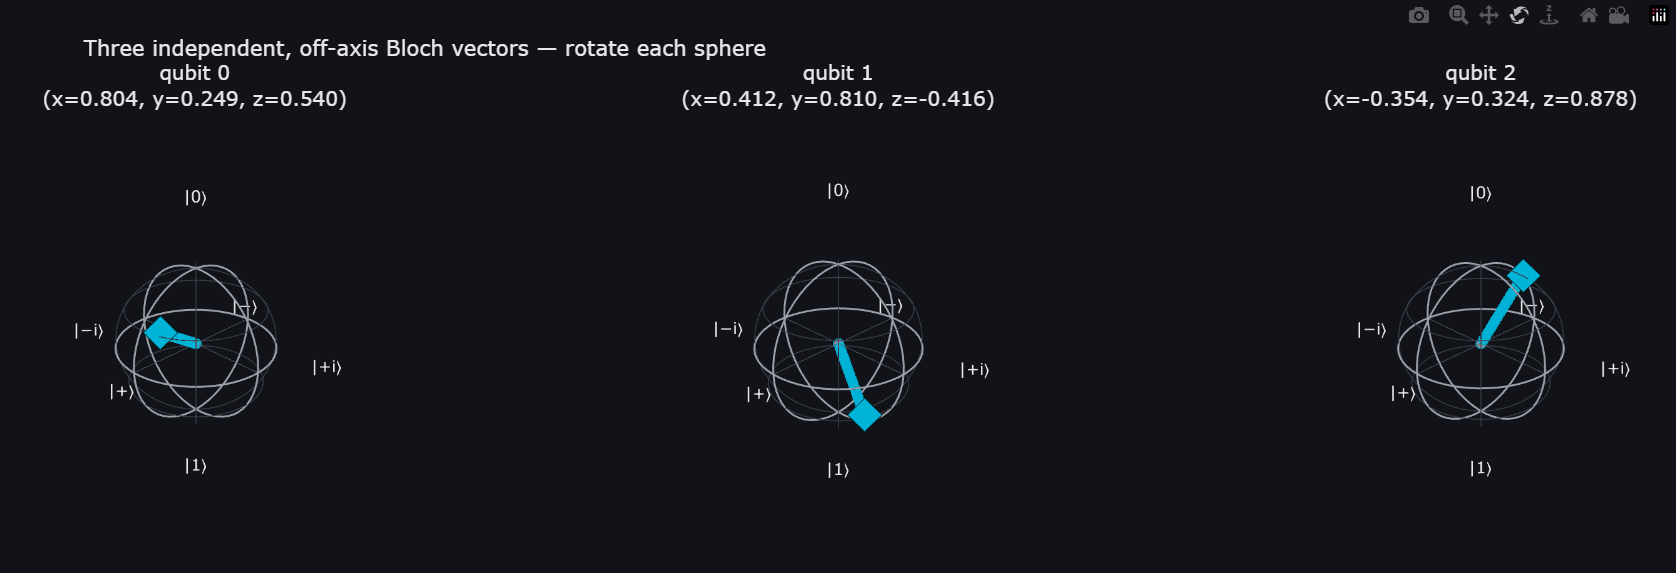
fig2 = plot_bloch_multivector_interactive(sv)
fig2.show()
Rotate, zoom, and hover for exact amplitude/phase/probability at each basis state.
Emission-spectrum rendering (merged from Qiskit EigenLight)
qiskit-stateviz also renders a Hamiltonian’s eigenspectrum as an emission spectrum — spectral lines positioned at true eigenvalue gaps, colored and intensity-scaled from the actual coherence structure of the evolving state, rather than a stylized stand-in for it. This was originally its own standalone package, Qiskit-EigenLight; it’s now merged in here rather than maintained as a second small package with its own release cadence.
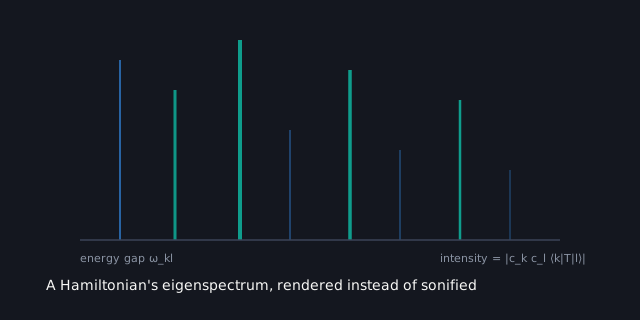
The same honest limitations carry over unchanged: the probe operator defaults to uniform all-pairs coupling rather than a real atom’s transition operator, and everything is unitary — no dissipation, so lines are infinitely sharp.
Two Spheres, One Spinor (merged from Spinor-Topology)
An interactive explainer, also merged in rather than kept as a third small standalone repo: why the Bloch sphere — the very picture plot_bloch_multivector_interactive above draws — is a simplification of a qubit’s true state in ℂ², and why a spin-1/2 particle needs a full 720° (4π) rotation, not 360°, to return to its original state. A single slider drives two synced dials: a Bloch-sphere point (period 360°) and the SU(2) rotation parameter θ/2 inside R(θ) = exp(−iθ n̂·σ/2) (period 720°), with live α/β amplitude readout computed from the actual rotation rather than approximated.
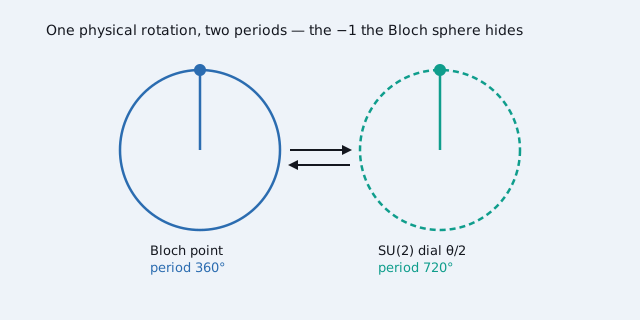
The −1 phase picked up by a full 360° rotation is invisible on the Bloch sphere (global phase drops out of it entirely) but was measured directly, in Hilbert space, by the 1975 neutron interferometry experiments (Rauch, Zeilinger, Badurek, Wilfing, Bauspiess, and Bonse; independently, Werner, Colella, Overhauser, and Eagen) — real experimental confirmation, not just a formal curiosity, and the reason the Bloch-sphere picture used throughout the rest of this page is a real simplification, not a full description.
Why this exists
There’s real prior art, and it’s worth naming rather than pretending this fills an empty gap:
- Kaleidoscope (Paul Nation, IBM Quantum) has interactive Plotly
qsphere()andbloch_sphere()functions with rendering that still works well — but its Qiskit integration layer hard-requiresqiskit-terraandqiskit-ibmq-provider, both merged or deprecated since Qiskit 1.0, so it fails on any current install. - plotly-qsphere is a small, focused interactive Q-sphere on Plotly, but doesn’t cover Bloch spheres, density matrices, or mixed states.
- Quantum-Glasses is an actual Qiskit Ecosystem member, but it’s a Tkinter desktop GUI limited to single-qubit states — not a notebook-native tool.
qiskit-stateviz is built fresh against current Qiskit (>=2.0, tested against 2.5.x), takes Statevector/DensityMatrix directly with no legacy dependencies, and covers both Q-sphere and per-qubit Bloch views in one package.
An honest limitation
Like Qiskit’s own plot_bloch_multivector, the per-qubit Bloch view only shows single-qubit marginals — reduced density matrices. A maximally entangled qubit’s Bloch vector has zero length even though the full joint state is pure, so this view cannot show entanglement. Use plot_qsphere_interactive for multi-qubit structure instead. Worth knowing before you read too much into a short Bloch vector.
Testing
Amplitude/phase and partial-trace math are cross-checked in the test suite against Qiskit’s own partial_trace and expectation_value reference implementations — not just asserted against expected output shapes.
Roadmap
- Interactive
plot_state_city/plot_state_hintonequivalents ipywidgetsslider for live circuit-parameter sweeps
Links
- Repository
- Qiskit Ecosystem listing — classified
Tooling, labeledquantum information pip install qiskit-stateviz